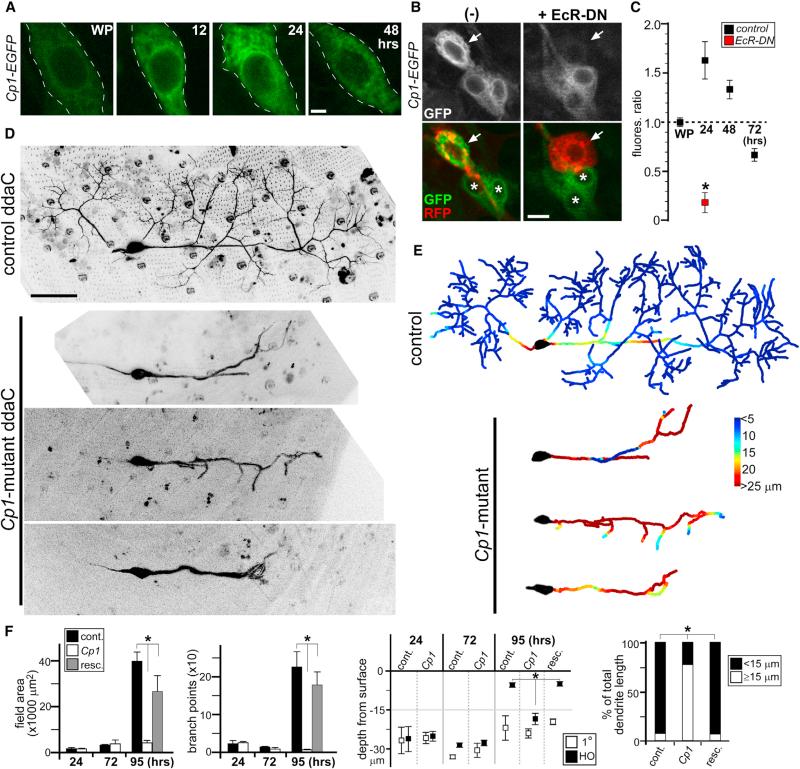
Figure 2. Cp1 Function during Dendrite Regrowth.
(A) Live imaging of Cp1-EGFP fluorescence in ddaC neurons during metamorphosis.
(B) Live imaging of Cp1-EGFP fluorescence in ddaC neurons expressing EcR-DN receptor (ppk-Gal4; UAS-mCD8::RFP; UAS-EcR-DN). Arrows point to RFP+ ddaC neurons. Note that Cp1-EGFP expression in neighboring cells (*) is unaffected by EcR-DN expression via ppk-Gal4 driver.
(C) Quantitative analyses of Cp1-EGFP fluorescence levels: average ratio of EGFP/RFP signal from ddaC neurons in WP is set to 1 (n = 6 in all groups). *p < 0.005, Wilcoxon two-sample test. Error bars represent SEM.
(D) Live imaging of control and Cp1-mutant ddaC neuron clones at 95 hr APF. Three representative Cp1-mutants are shown.
(E) Corresponding colorimetric representation of dendritic arbor depths in (D).
(F) Quantitative analyses of Cp1-mutant dendrite regrowth defects: field area, branchpoints, depth of primary (1°) and higher-order dendrites from surface, and percentages of total dendrite length at 95 hr APF that are shallow (within 15 μm from the body wall) or deep (≥15 μm). cont., control; resc., rescue. n ≥ 6 in all groups. *p < 0.001, one-way ANOVA. Error bars represent SEM.
Scale bars, 2 mm (A), 5 mm (B), and 50 μm (D). See also Figure S3.

