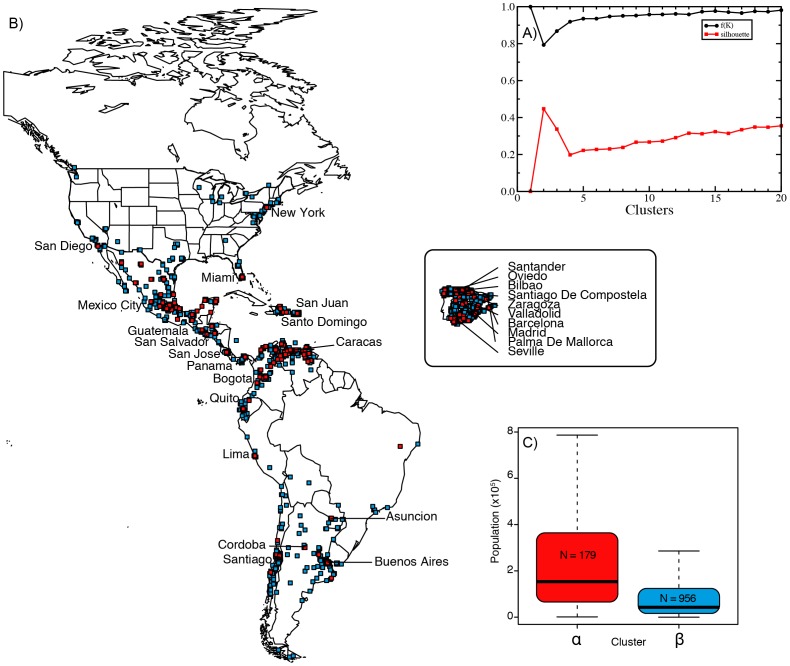
Figure 4. Characterization of the two superdialects.
A)  and silhouette statistics as a function of
  . B) Geographical representation of the two clusters,
  (red) and
  (blue). For visualization purposes we increased the size of each cell. The name of main cities corresponding to superdialect
  are shown for clarity. C) Population distribution of the cells corresponding to each cluster.

