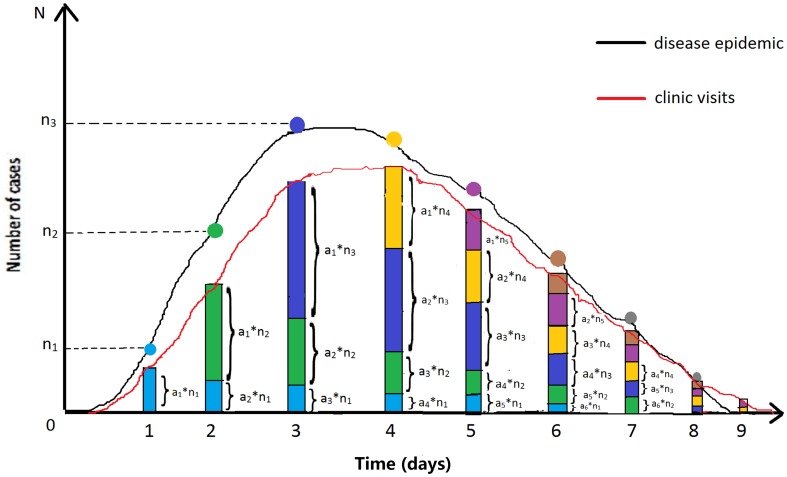
Figure 2. Sketch diagram of conversion principle from simulated outbreak data to syndromic data.
Clinic visits data were used as an example; ai is the probability of patients visiting doctors at day i; ni is the number of new outbreak cases at day i. The number of new cases at day 1 is n1. Of these, a1n1 cases will visit doctors in clinics on that day; a2n1 cases will visit doctors on the second day; a3n1 will do so on the third day (light blue pillars), etc. On day 2, there are n2 new cases, of which a1n2 cases will visit doctors in clinics on that day; a2n2 cases will do so on the second day; a3n2 will do so on the third day (green pillars), etc. As a result, the sum of the visiting volumes on day 1 is a1n1; on day 2, it is a2n1 + a1n2; on day 3, it is a3n1 + a2n2 + a1n3; etc.

