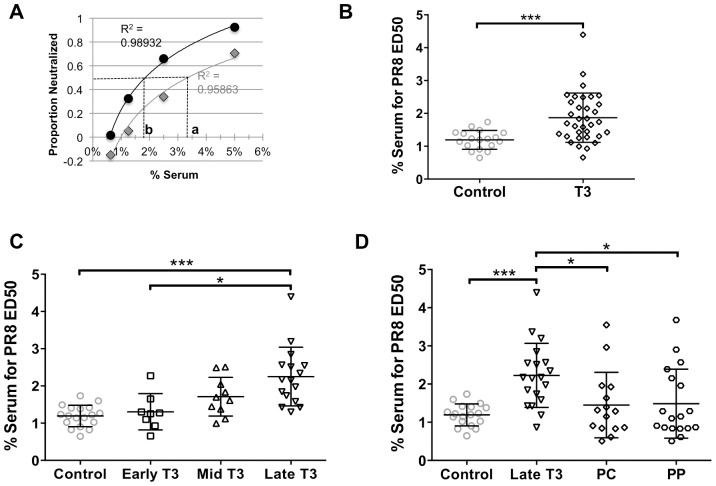
Figure 6. Capacity of T3 and postpartum serum C′ to neutralize PR8-GFP.
C′ neutralization capacity was quantified as a function of the serum concentration effective in achieving 50% neutralization (ED50) for each animal. (A) Logistic regressions for two example animals, where dashed line crossing the x-axis (a or b) represents the ED50 for each animal; R2 is the coefficient of determination as an indication of how well the data points fit the regression model. ED50s were determined for AGMs at a range of gestation and postpartum dates: (B) T3 = 110–165 days; Shapiro-Wilks normality test indicated T3 population was not normally distributed; difference between T3 and control group tested with Mann-Whitney compare ranks two-tailed non-parametric test. (C) Early T3 = 110–128 days, Mid T3 = 129–146 days, Late T3 = 147–165 days gestation; (D) PC = parturition check-in, 5–10 days after parturition; PP = postpartum, 2–6 months after parturition. Differences among groups in panels C and D were tested with one-way ANOVA with Tukey correction for multiple comparisons. Lines within data point distribution represent mean +/−SD in panels B–D; * p<0.05; ** p<0.001; *** p<0.0001.

