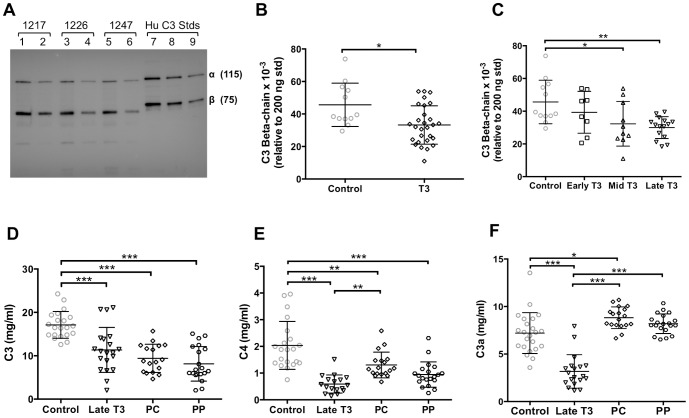
Figure 7. C′ factor quantification in T3 and postpartum AGMs.
AGM serum C3 β-chain was quantified by western blot relative to purified Hu C3 standards. (A) Representative western blot with 1∶200 (lanes 1, 3, and 5) and 1∶400 (lanes 2, 4, and 6) serum dilutions shown sequentially for each of three different animals (1217, 1246, and 1247). Standards of 200 ng, 100 ng, and 50 ng of human C3 are in lanes 7, 8, and 9, respectively. (B) Quantification of serum C3 β-chain in T3 vs control animals, based on C3 β-chain band associated with 200 ng of standard Hu C3; difference between groups tested with unpaired two-tailed t-test. (C) Quantification of serum C3 β-chain across T3 tertiles (times defined in legend for Fig. 6C). ELISAs were used to quantify (D) C3, (E) C4, and (F) C3a, relative to purified human standards for each protein, during late T3 and at postpartum timepoints, as defined in the legend for Fig. 6D. Differences among groups in panels C–F were tested with one-way ANOVA with Tukey correction for multiple comparisons. Lines within data point distribution represent mean +/− SD in panels B–F; * p<0.05; ** p<0.001; *** p<0.0001.

