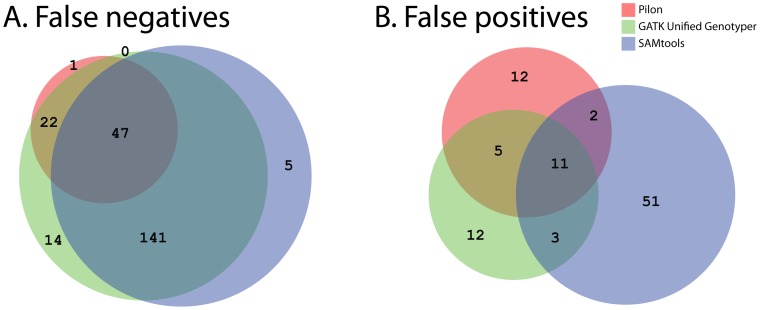
Figure 4. Venn diagram of the overlap in false negative (A) and false positive (B) calls by the three variant detection tools, Pilon, GATK UnifiedGenotyper and SAMtools.
False negative calls are the number of unique events from the curation set that was missed by each tool. Overlaps in the Venn diagram show the number of variants that were missed by multiple tools. False positive calls are the number of predictions from M. tuberculosis F11 that were not supported by the curation set. Overlaps indicate predictions that were shared among tools.

