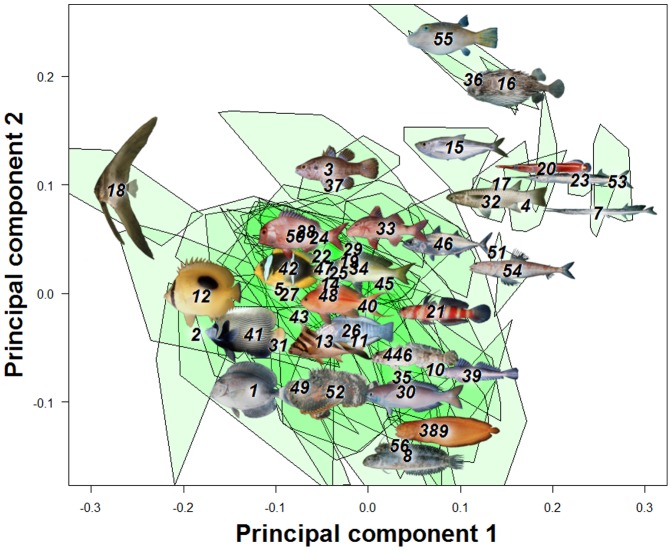
Figure 2. A principal component analysis (PCA) on overall fish shape data showed four main axes of shape deformation representing respectively 32.1%, 26.22%, 13.23% and 6.87% of the overall shape variation in reef fishes (A & B).
Fish pictures and family numbers are placed on the centroid of each family and used to identify their relative position in the morphospace. A green polygon is used to represent the spread of species for each family.

