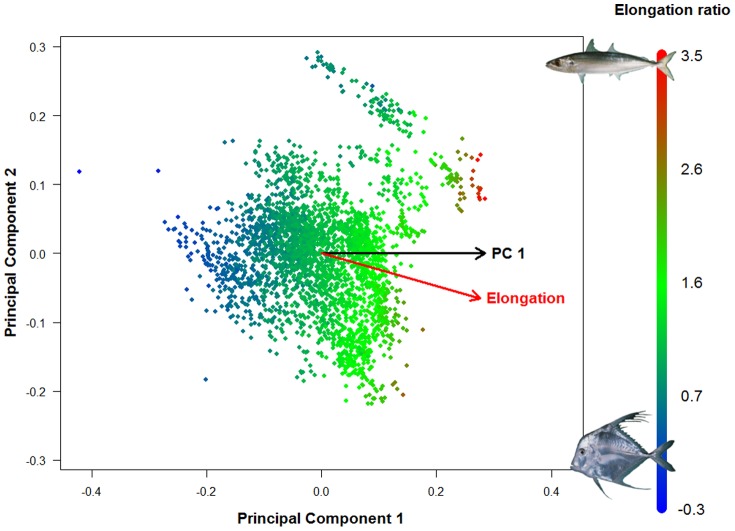
Figure 5. The fish morphospace presented in figure 2A is represented here with each species colored by their elongation ratio ( Fig. 1 ).
High ratios represent elongate fish while low ratio represents deep bodied fishes. The PC1 and elongation vectors are also represented on this morphospace. Based on our resampling procedure, the small angle between these two vectors (14.35°) indicate that elongation is significantly associated to the main axis of shape diversification (p<0.001).

