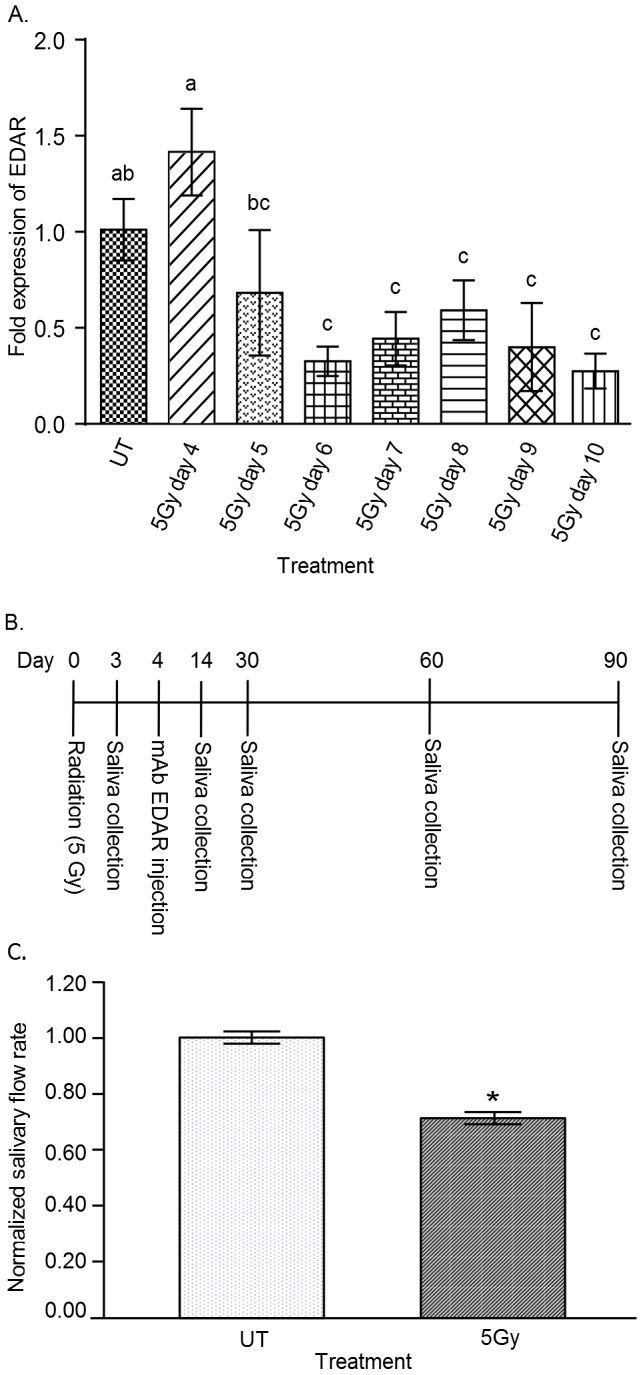
Figure 1. Analysis of Edar expression following radiation and experimental design of study.

(A) On day 0 the head and neck region of mice was exposed to a single dose of 5 Gy radiation. Edar expression (mRNA) in parotid salivary glands was determined on days 4–10 post-radiation as described in the materials and methods and graphed as fold over unirradiated (UT). Significant differences (p<0.05) were determined using an ANOVA followed by a Bonferroni post-hoc test. Treatment groups with the same lower case letters are not significantly different from each other. N = 4 mice per group. (B) Experimental design timeline. (C) Three days post-radiation stimulated salivary flow rates were determined as described in the materials and methods. Irradiated flow rates were normalized to corresponding unirradiated (UT) controls. There were 60 animals in the control (UT) and 62 animals in the irradiated group (5Gy). Significant difference (p<0.05) was determined by t-test and designated by an asterisk (*). All error bars represent standard error of the mean (SEM).
