
Figure 2. Contribution of the main taxonomic groups to the phytoplankton communities (by biovolume) at stations B1 (closed symbols) and H4 (open symbols) in June-August (mean ± SD; years 1986–2009).
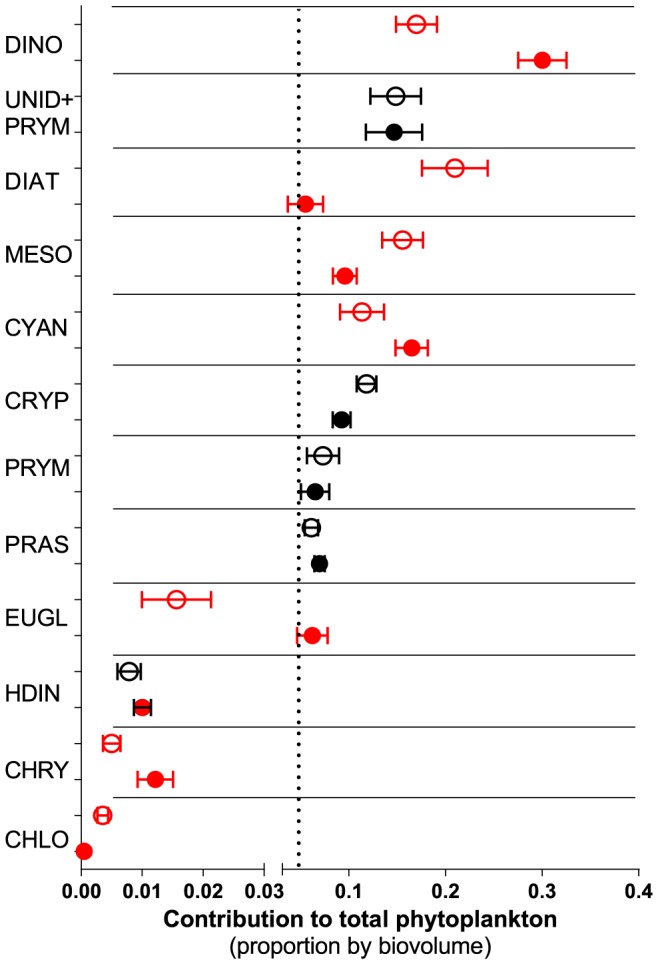
Significant differences between the stations (paired t-test, p<0.05) are indicated in red. Dotted line indicates 5% threshold for including a phytoplankton group in the GLM analysis of the field survey study.