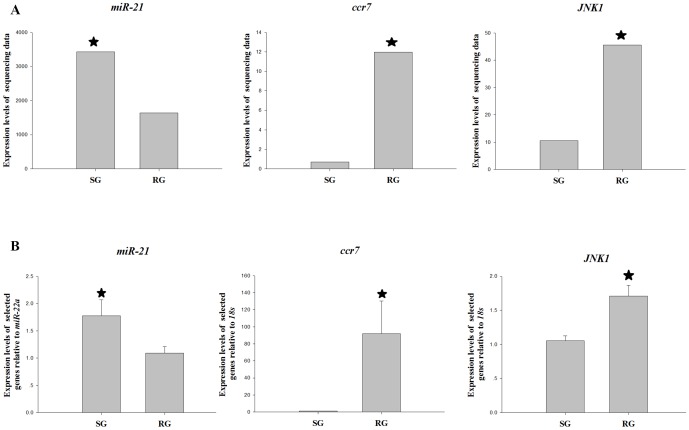
Figure 4. The expression analysis of selected genes from the expression profile by relative quantitative real-time PCR.
A Transcriptome sequencing data, B Real-time PCR data. Increases and decreases in relative levels of transcripts with respect to the control 18s for mRNA and miR-22a for miRNA are shown. The settings “q.value <0.005” and “|log2.Fold change.normalized|>2” were used as thresholds for judging significant differences in transcript expression. One-way ANOVA tests were performed using SPSS 17.0 to determine significant differences for Real-time PCR data. Statistical significance of the relative expression ratio is indicated *.

