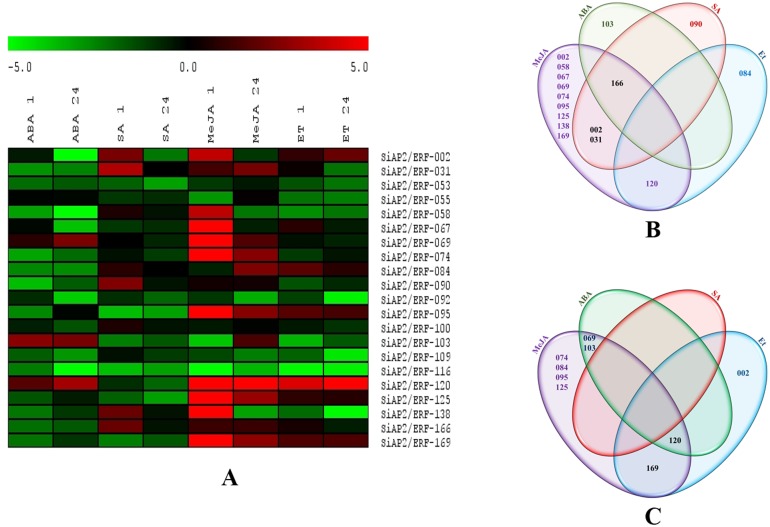
Figure 9. Expression profile of 21 SiAP2/ERF genes in response to Abscisic acid (ABA), salicylic acid (SA), methyl jasmonate (MeJA) and Ethephone (Et) treatments.
(A) Heat map showing differential gene expression in response to ABA, SA, MeJA, Et treatments across two time points (1 h and 24 h). The heat-map has been generated based on the fold-change values in the treated sample when compared with its treated control sample. The color scale for fold-change values is shown at the top. (B) Venn diagram showing stress-specific higher-expression of SiAP2/ERF genes during early hormonal treatment. (C) Venn diagram showing stress-specific higher-expression of SiAP2/ERF genes during early hormonal treatment. The common subset of genes regulated by the hormonal treatments is marked by the overlapping circle. The numbers provided in the venn diagram corresponds to the SiAP2/ERF ID listed in Table S2.

