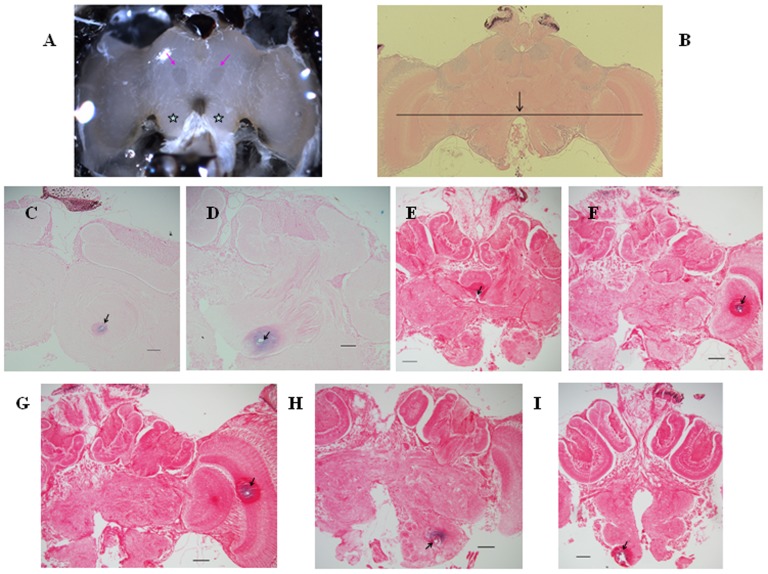
Figure 4. New brain landmarks and prussian blue paraffin sections verifying the stimulation sites.
Scale bars 50 µm. (A) Honeybee brain under the stereomicroscope. The two pink arrows indicate landmarks for the α-lobes: small mango-shaped regions. The two stars indicate the antennal lobes. (B) Frontal brain section showing the arc-shaped border of the gap between the two antennal lobes, which is aligned approximately to the centers of the medulla and lobula. (C–I) Paraffin-embedded frontal brain sections dyed with prussian blue. Arrows show the stimulation sites on the α-lobe, β-lobe, ellipsoid body, lobula, medulla, antennal body and suboesophageal ganglion, respectively. Note that each picture shows a hole of around 15 µm with a large surrounding sphere with different staining; this arose because the monophasic dissociating pulse (20 µA DC, 15–20 s) generated polarization and hydrolysis around the electrode tip and produced tissue damage.

