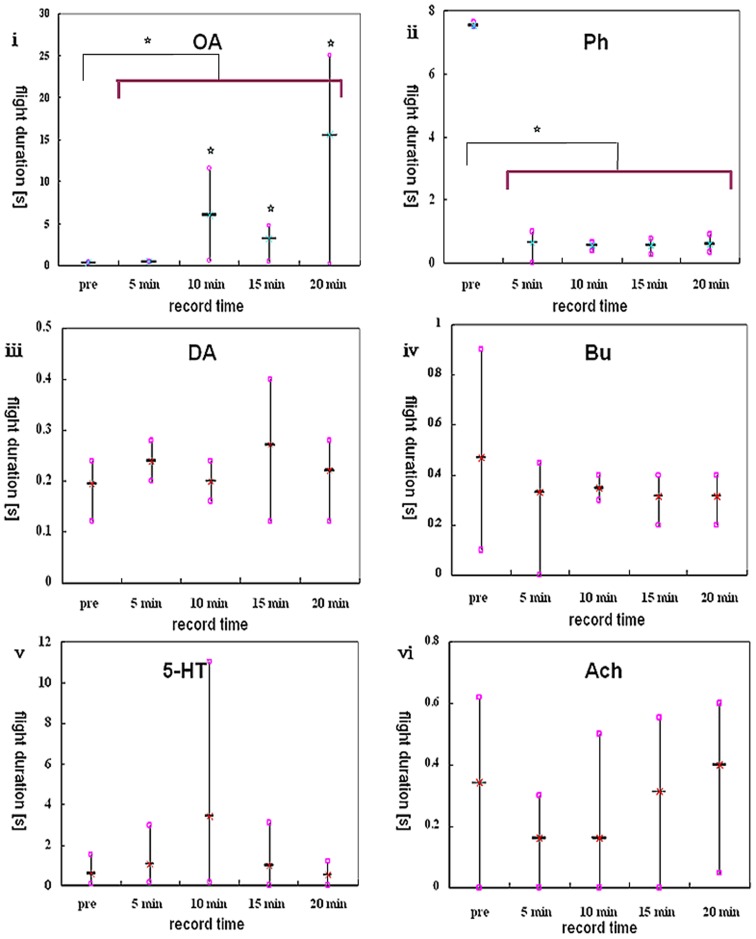
Figure 6. Whisker diagrams showing analysis results.
The drug used is abbreviated at the top of each diagram. Stars in i indicate that the flight durations from three post-delivery videos are all statistically different from the pre-delivery video ensemble (p<0.05). Two stars above the transverse line in ii and ii indicate statistical differences in flight durations between two video ensembles (before and after delivery) (p<0.05).

