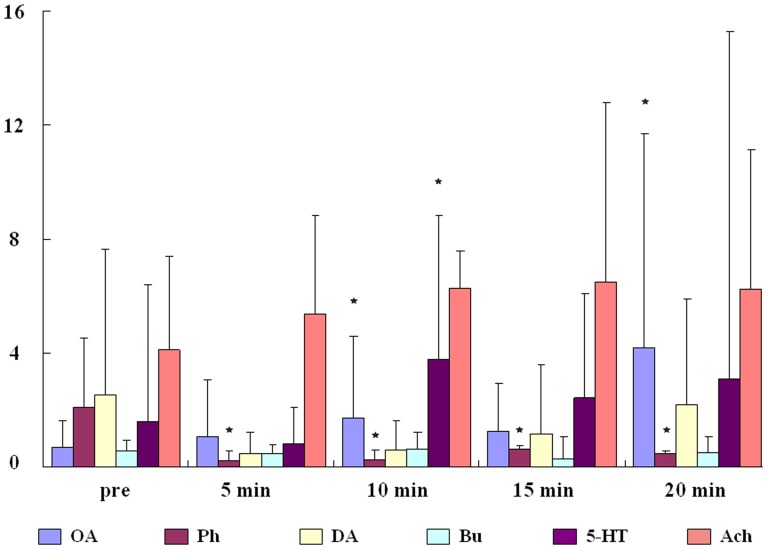
Figure 7. A box and whisker plot showing group-level data analysis, in which the box shows the mean and the whisker shows the standard error (SE).
Stars indicate statistical differences that are found in the comparison of group averaged flight durations in pre-delivery ensemble and each post-delivery video by ANOVA.

