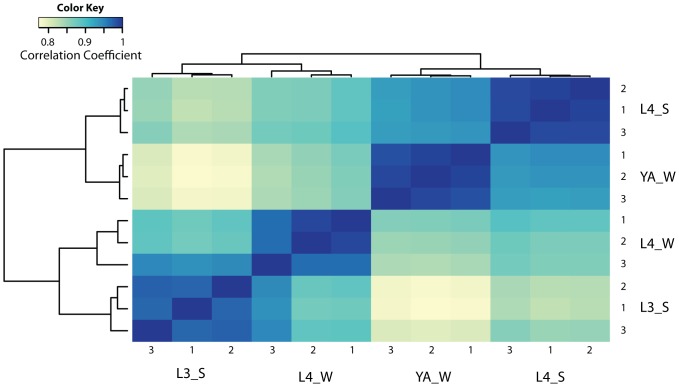
Figure 2. Cross-correlation analysis.
Cross-correlation plot obtained by microarray analysis of worms during L3 sleep-like behavior, L4 wake, L4 sleep-like behavior, and young adults during wake. Heat map analysis shows that the biggest changes in gene expression are due to developmental progression and not molting.

