Figure 5.
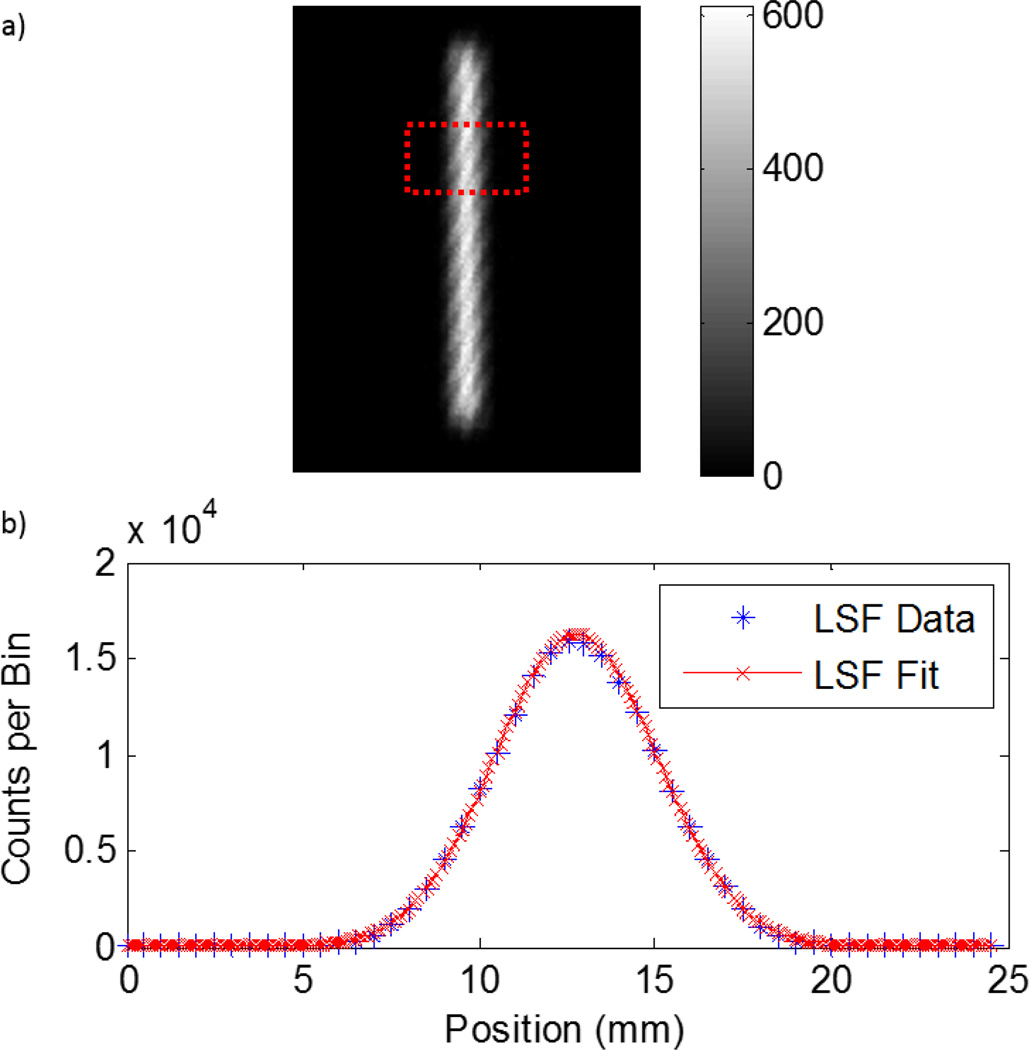
Total system resolution measurement and analysis. (a) A representative projection of the 1-mm diameter capillary at a 2-cm distance from the modelled HPGe camera. The scale is in units of counts. The box signifies one set of horizontal line profiles summed together to generate a LSF. Five LSFs are generated per projection. (b) The LSF created from the data within the box for estimating the total resolution. The LSF data was fitted to a Gaussian function, whose FWHM and FWTM were taken for spatial response measurements.

