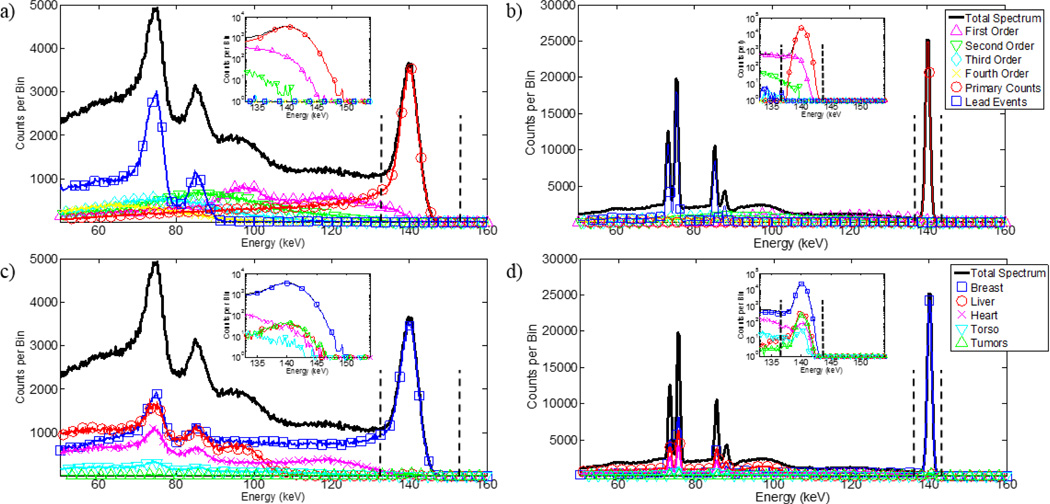
Figure 7.
Generated energy spectra from the breast imaging simulations. (a) CZT spectrum parsed by scatter order. (b) HPGe spectrum parsed by scatter order. (c) CZT spectrum parsed by event origin order. (d) HPGe spectrum parsed by event origin. Legends describe plots along same horizontal axis. The vertical dashed-lines signify energy windows of −5%/+10% on CZT and ±2.5% on HPGe placed around the 140-keV photopeak. Log-scale insets of the photopeak are displayed in each plot. The low-energy tailing of CZT removes primary events from the energy window and the image. The 1% ER at 140 keV of HPGe provides sharp peaks that enable the use of narrower energy windows to minimize inclusion of out-of-field radioactivity that undergoes small-angle scattering.

