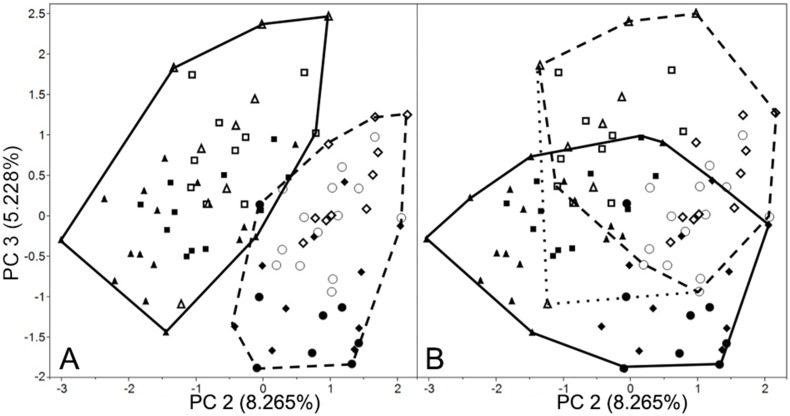
Figure 3. PCA output with second principal component (x-axis) against third (y-axis) from analysis of linear variables.
Minimum convex lines describe: A. tigers (solid) and lions (dashed); B. captives (solid) and wilds (dashed) with a single wild outlier AMNH 85396 (dotted). Markers represent female tigers (squares), male tigers (triangles), female lions (circles), and male lions (diamonds). Wild specimens are represented by open markers and captive specimens by closed markers. See Table 5 for linear PCA scores.

