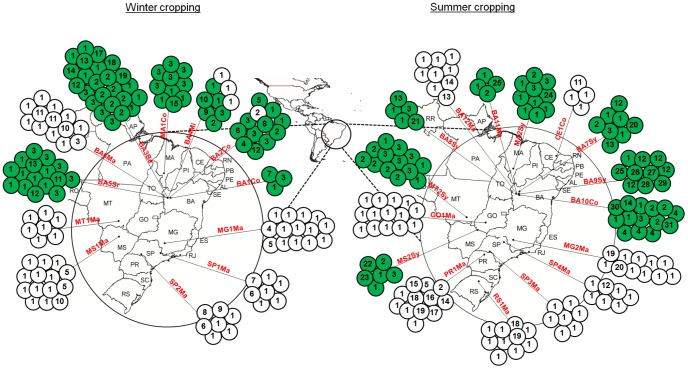
Figure 1. Geographic distributions of COI haplotypes of H. armigera and H. zea.
One hundred and thirty nine and 135 COI haplotypes were analyzed for these species, respectively. The samples were separated into two temporal groups (winter crops and summer crops). Each circle represents the haplotypes identified in a given population; a number within a circle denotes the COI haplotypes identified in that population. Colored circles refer to H. armigera specimens, and white circles refer to H. zea specimens. The abbreviations refer to the sampled locations and crops (Table 1).

