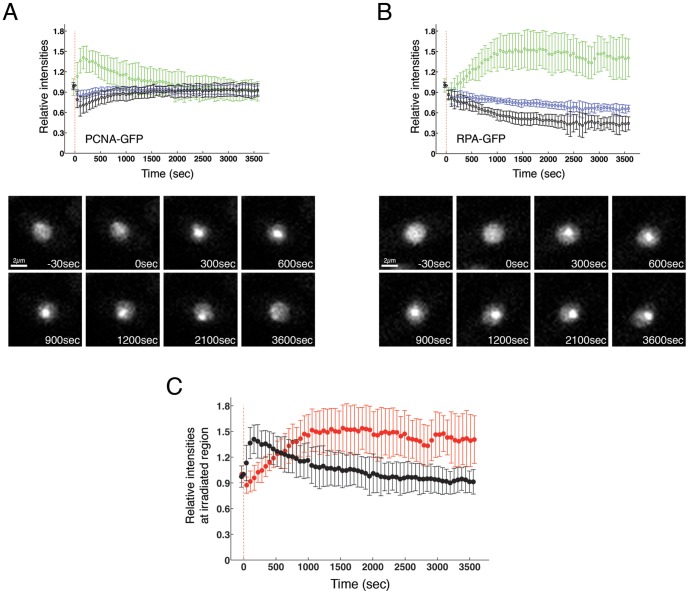
Figure 4. PCNA is recruited to the damage site before RPA. GFP-PCNA (A) or RPA-GFP (B) expressing cells were irradiated at a power of 15% and cells were monitored every 30 seconds over 60 minutes.
The average intensity of GFP-PCNA at the irradiated site (green), in the entire nucleus (blue) and in the area of the nucleus that was not irradiated (black) was quantified and plotted as indicated in Materials and Methods. 10–15 cells per strain were irradiated (upper panels). Example images of both strains are shown in the lower panels (C) The intensity of the fluorescence at the site of the damage was quantified and plotted for both strains in the same graph to allow easier comparison of the kinetics. Black: GFP-PCNA; Red: RPA-GFP

