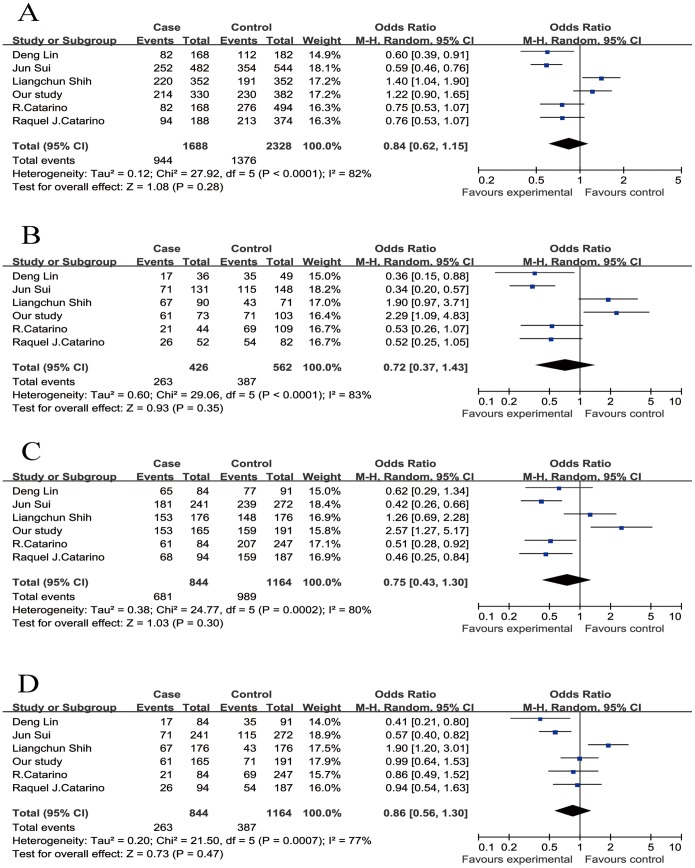
Figure 1. Forest plot of the risk of nasopharyngeal carcinoma associated with the CCND1 G870A polymorphism.
A, the alleles model (A vs. G); B, the co-dominant model (AA vs. GG); C, the dominant model (AA/AG vs. GG); D, the recessive model (AA vs. AG/GG). Error bars indicate 95% CI. Solid squares represent each study in the meta-analysis. Solid diamonds represent pooled OR.

