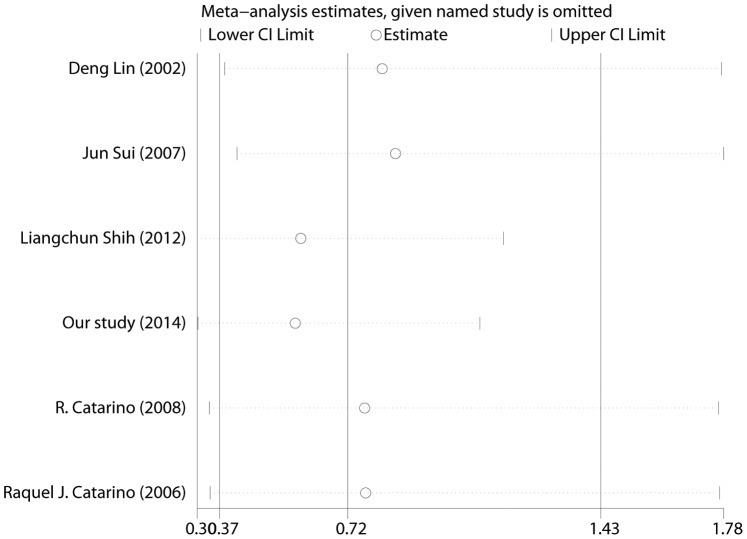
Figure 2. Influence analysis for the co-dominant model (AA vs. GG) in the overall meta-analysis.
This figure shows the influence of individual studies on the summary OR. The middle vertical axis indicates the overall OR and the two vertical axes indicate its 95% CI. Every hollow round indicates the pooled OR when the left study is omitted in this meta-analysis. The two ends of the dotted lines represent the 95% CI.

