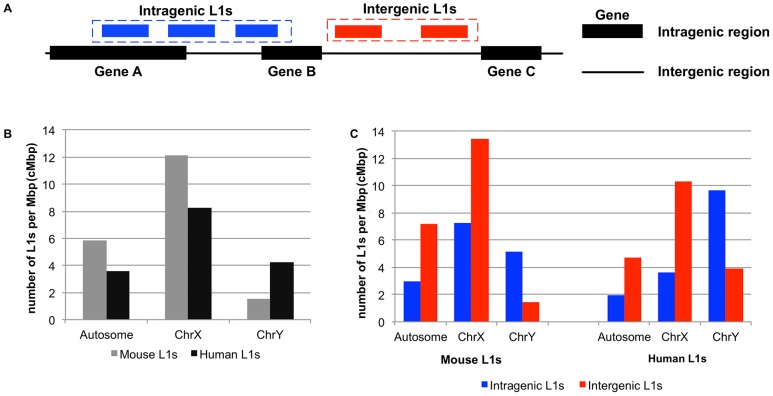
Figure 1. Distribution of mouse and human L1s over their genomes.
(A) Graphical definition of intragenic and intergenic L1s. An intragenic L1 is represented by a blue box, while the intergenic one is represented in a red box. The black box represents a gene (intragenic region) and the black line represents an area outside (intergenic region) the gene bodies. (B) A bar graph shows the distribution of mouse (gray columns) and human (black columns) L1s residing on autosome, X, and Y-chromosomes. (C) Two side-by-side bar graphs comparing intragenic (blue columns) vs. intergenic (red columns) L1s on mouse and human genomes.

