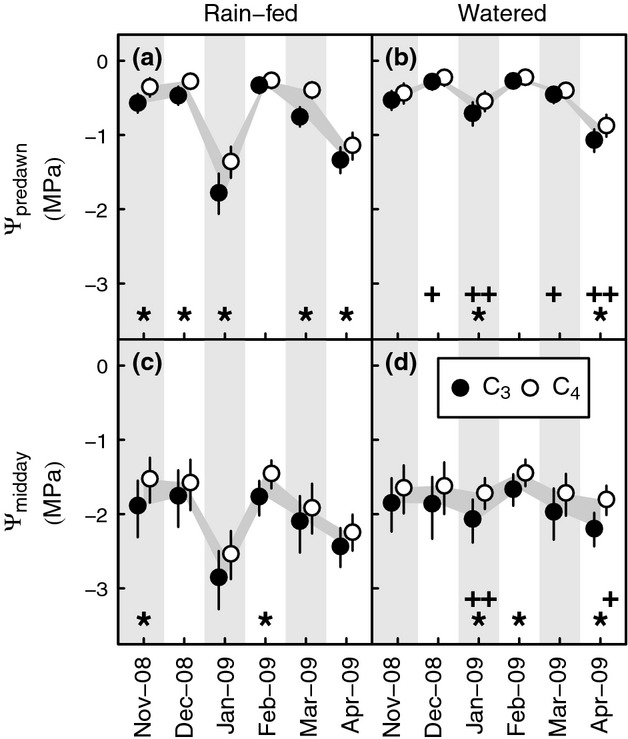
Figure 2.

Seasonal contrasts in leaf water potential between C3 and C4 PACMAD grasses in a common garden experiment at Grahamstown, Eastern Cape of South Africa, between November 2008–April 2009. (a,b) Predawn water potential, Ψpredawn; (c,d) midday water potential, Ψmidday. Points represent pooled means and 95% confidence intervals for 4–6 species in plots that were rain-fed (a,c) or given supplemental water (b,d). Values are back-transformed from the log-transformed scale used for statistical analysis. Differences between photosynthetic types and months in the experiment are highlighted by grey-filled areas. Photosynthetic type comparisons for which confidence intervals indicate significance at the P < 0.05 level are highlighted by * within each pane. Significant differences within photosynthetic types that resulted from watering are indicated by + below the relevant means in (b) and (d).
