
Figure 1.
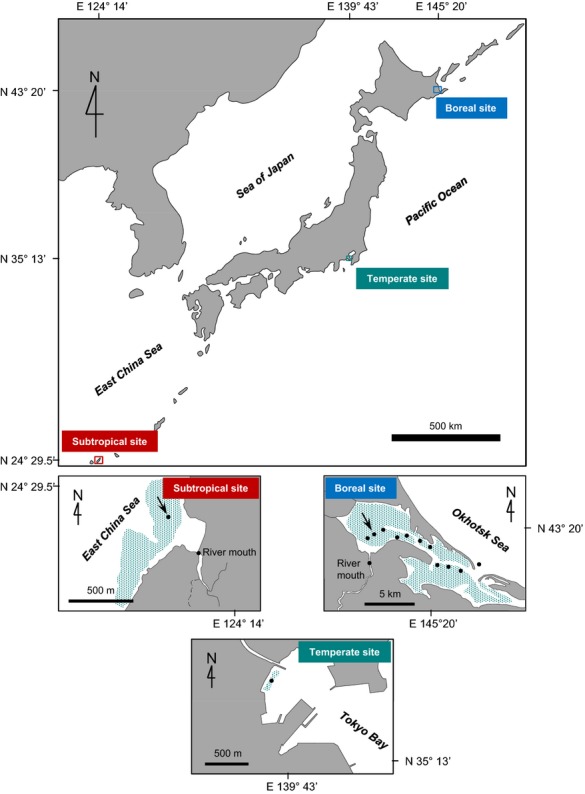
Location of study sites. The distribution of seagrass at each site is indicated by shading. The locations of water sampling sites are indicated by closed circles. Arrows indicate where air-sea CO2 fluxes were measured by the eddy covariance method. At the boreal site, we also performed a 48-h time series of discrete water sampling at the location indicated by the arrow.