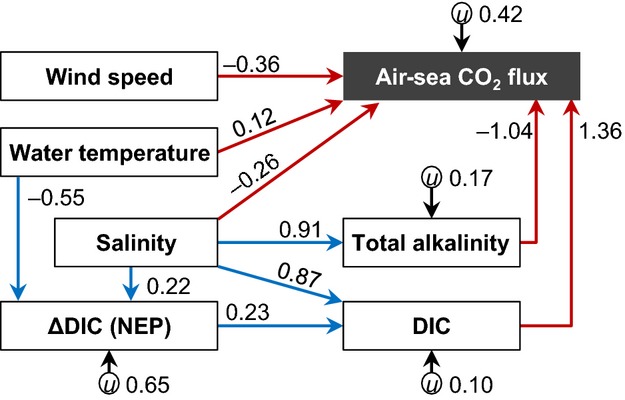
Figure 6.

Result of the SEM analysis (n = 170) showing direct factors (red arrows) and indirect factors (blue arrows) affecting the air-sea CO2 flux at the boreal and temperate sites. The value of a coefficient indicates the relative influence of the path. All the path coefficients are statistically significant (P < 0.05). The parameter u represents unknown factors.
