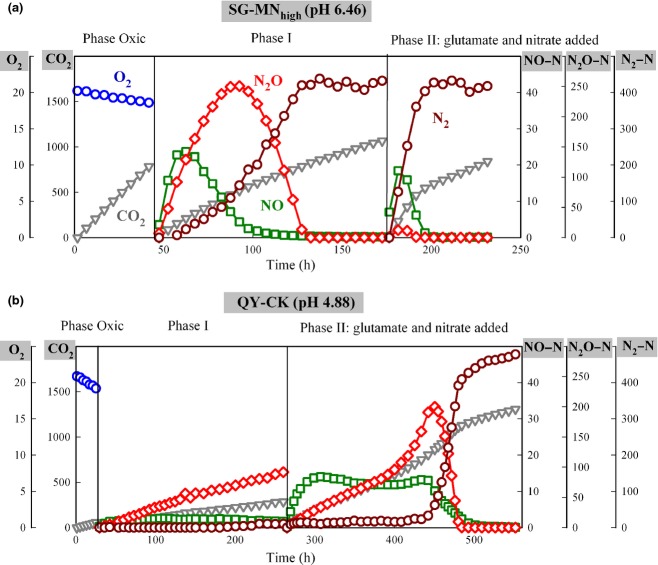
Figure 3.
Demonstration of O2, CO2, NO, N2O, and N2 gas kinetics during three incubation phases (Phase Oxic, Phase I, and Phase II). The results shown are single vial results for a soil with high pH (Shouguang MNhigh treatment with pH 6.46; top panel) and a soil with low pH (Qiyang CK treatment, pH 4.88; lower panel). The O2 concentration during Phase Oxic is shown as vol% in the headspace, CO2 and N2 are shown as cumulative production (nmol g−1 soil dry weight), whereas the intermediate denitrification products NO and N2O are shown as measured (nmol g−1 soil dry weight).

