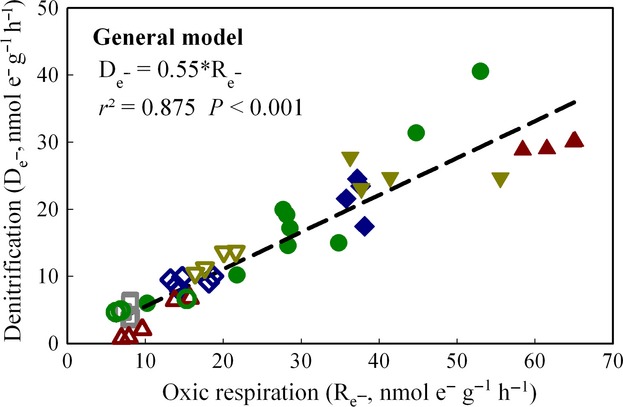
Figure 4.

Relationship of the electron flow rates in Phase Oxic respiration (Re−) and in Phase I denitrification (De−). Data for single vials with soil from Gongzhuling (GZL,  ), Shangzhuang (SZ,
  ), Qiyang (QY,
  ), Changwu (CW,
  ), and Shouguang (SG,
  ) are shown. The closed symbols show the treatments with manure; the open symbols show the treatments without manure. Linear regression function is shown (De− = 0.55*Re−; r2 = 0.875, P < 0.001).
