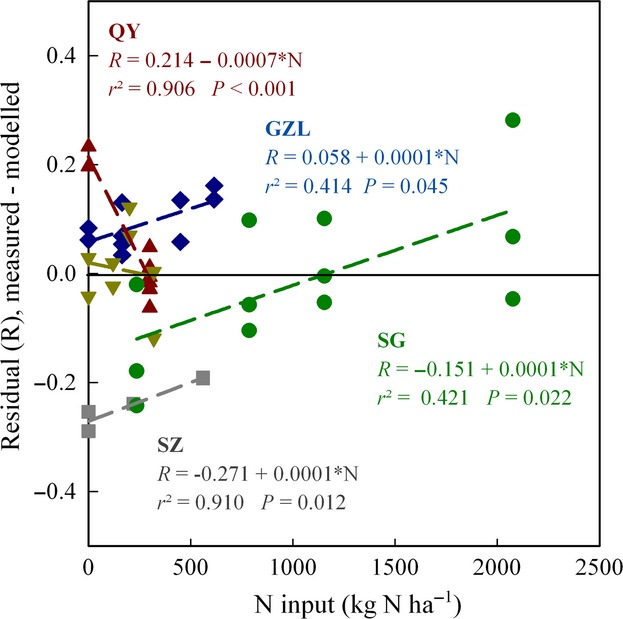
Figure 7.

Residuals from the general regression if  Phase I against pH (model:
  = 1.64–0.18*pH, see Fig6a), plotted against the annual input of total nitrogen (mineral N + organic N). Data for single vials with soil from Gongzhuling (GZL,
  ), Shangzhuang (SZ,
 ), Qiyang (QY,
 ), Changwu (CW,
 ), and Shouguang (SG,
 ) are shown. Trends are shown for individual sites.
