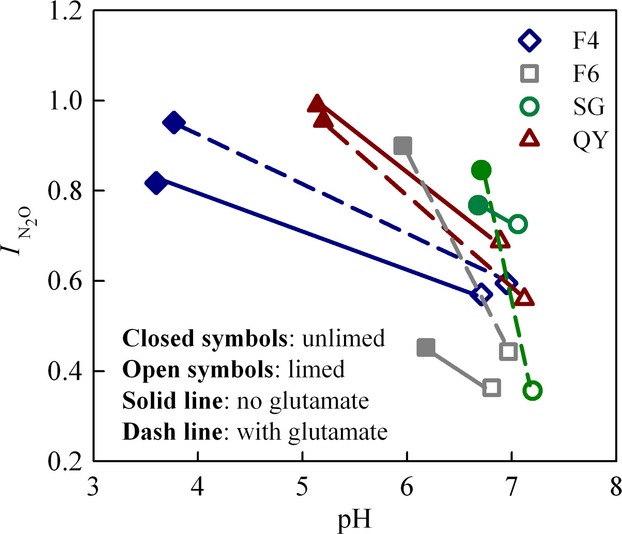
Figure 9.

Relationship between soil pH and N2O production index in the liming experiment. The four soils limed were peat soil from Fjaler (Norway) with pH = 4 (F4), peat soil from Fjaler with pH with pH = 6 (F6), the Shouguang soil (SG) and the Qiyang soil (QY). The lines connect the results for limed (open symbols) and unlimed (closed symbols) for each soil and treatment (solid lines: no glutamate added, dashed lines: glutamate added). For the mineral soils (QY and SG), the indexes ( ) were calculated for the time period from 0 to T (Eqn 1), where T is the time when 100 nmol NO3−N g−1 soil had been recovered as (NO+N2O+N2)−N. For the peat soils (F4 and F6), the indexes (
 ) were calculated for T = the time when 3000 nmol NO3−N g−1 soil had been recovered as (NO+N2O+N2)-N.
