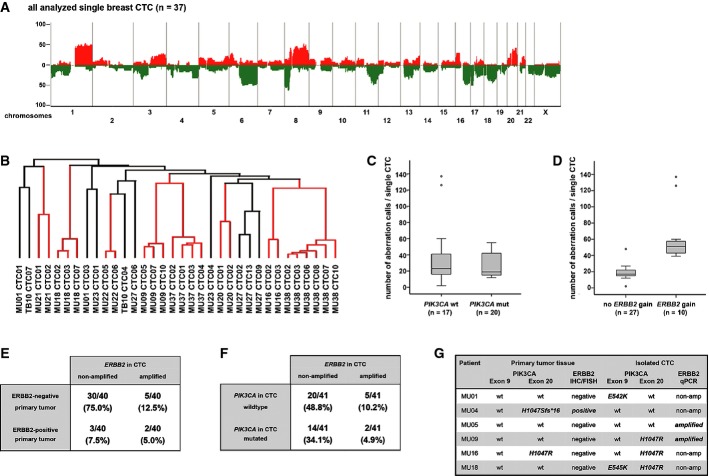
Figure 4. Molecular heterogeneity of breast cancer CTCs.
A Chromosomal aberrations in 37 single CTCs of 15 breast cancer patients. The histogram plot displays the frequency of genomic gains (red) and losses (green) of CTCs, which are characteristic for breast cancer cells.
B Unsupervised hierarchical cluster analysis using the average linkage mode of breast cancer patients with more than one analyzed CTC (34 cells of 12 patients). Distances of vertical lines to the next branching point in dendrogram represent relatedness. Red vertical lines indicate that all analyzed CTCs of an individual patient are located within the same branch of the dendrogram.
C, D Number of chromosomal changes in PIK3CA-mutated (C) and ERBB2-amplified (D) versus wild-type CTCs. Note that CTCs with ERBB2 amplification showed a significantly higher number of genomic aberrations than CTCs without amplification (n = 37, Mann–Whitney U-test, P < 0.00001).
E ERBB2 status in CTCs versus ERBB2 status in primary tumors in individual pairs.
F PIK3CA mutational state and ERBB2 copy number gains in CTC of individual patients.
G Paired analysis of mutational states for PIK3CA and ERBB2 of primary tumors versus matched CTCs of six patients. Note that only patient MU16 displays shared states in primary tumors and CTCs.

