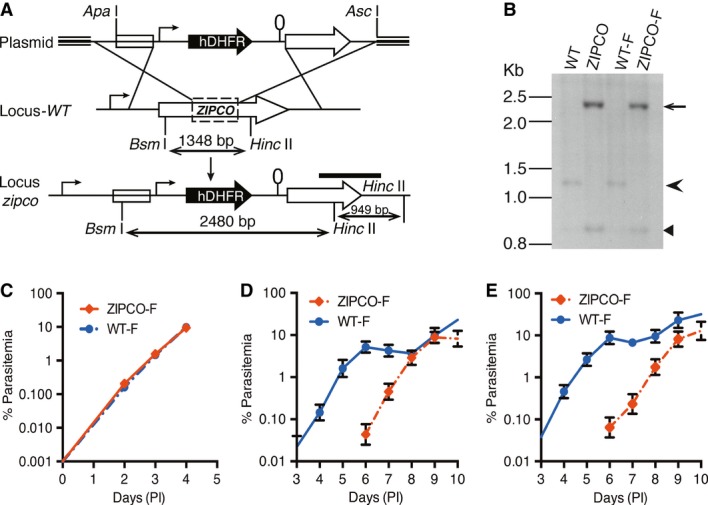
Figure 2. ZIPCO-F parasites develop normally in blood stages but sporozoites are less infectious to the mammalian host.

- Schematic representation of P. berghei zipco targeted gene disruption. The plasmid pBC-zipco-hDHFR used for homologous recombination is shown on the top with the hDHFR cassette indicated by a black arrow. The endogenous locus (Locus-WT) is shown in the middle; the dotted rectangle indicates the region deleted and replaced by the hDHFR cassette. The resulting recombinant locus is shown in the lower part. Sizes of restriction fragments obtained after digestion of genomic DNA with BsmI and HincII are indicated by double-sided arrows. The probe used for Southern blot analysis (see panel 2B) is shown as a black bar.
- Analysis of zipco locus in WT and recombinant parasites. Genomic DNAs from NK65 (WT), ANKA-GFP (WT-F), and recombinant clones ZIPCO and ZIPCO-F were digested with BsmI and HincII. A probe from the 3′UTR region (shown in 2A) was used for analysis. The WT (1,348 bp) and recombinant (2,480 bp) restriction fragments detected are indicated by an arrowhead and arrow, respectively. The 949 bp HincII fragment, present in both WT and recombinant loci, is indicated by a small arrowhead.
- Graph showing the multiplication of WT-F and ZIPCO-F blood stages. Mice were injected with mixed blood stages to obtain an initial parasitemia of 0.001%. The parasitemia was followed daily for 4 days on Geimsa-stained blood smears. Graph represents the mean parasitaemia ± SD (n = 6 mice in each group).
- Graph showing the mean parasitemia ± SD of mice after intradermal injection with 25,000 WT-F or ZIPCO-F sporozoites. (n = 5 mice in each group).
- Graph showing the mean parasitemia ± SD of mice after intravenous injection with 25,000 WT-F or ZIPCO-F sporozoites. (n = 5 mice in each group).
Source data are available online for this figure.
