
Figure 3. Immunofluorescence analysis of microglia, macrophages and T cells in the lumbar spinal cord in vehicle and R-flurbiprofen treated C57BL6/J mice (10 mg/kg/day) in the EAE model with preventive treatment (from day 3).
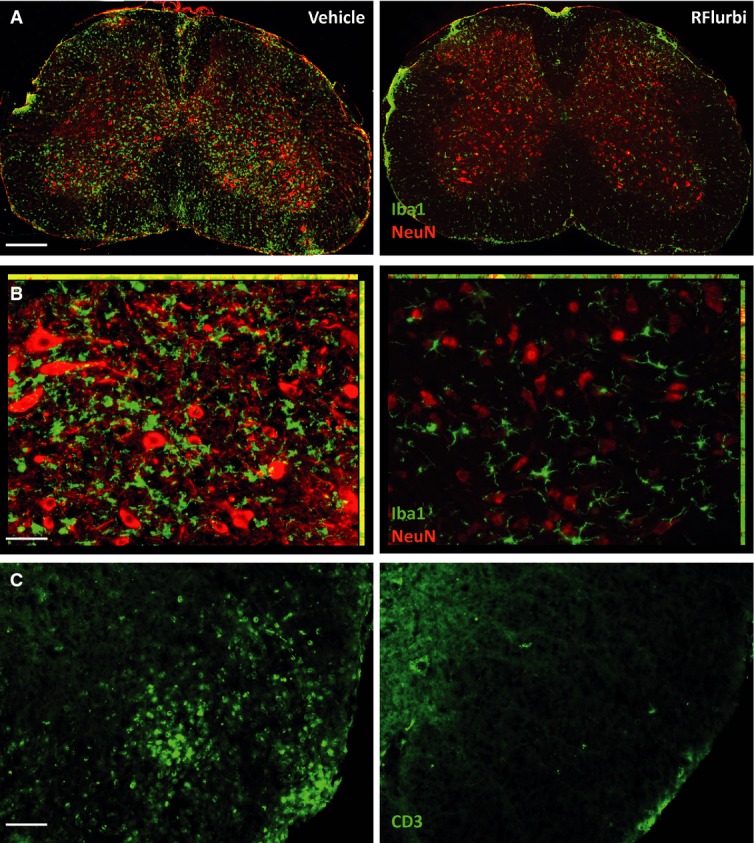
The spinal cord was dissected out during the flare of the disease, day 22. Representative images of 4 mice per group.
- Immunofluorescence of ionized calcium binding adaptor molecule 1 (Iba-1, green) in microglia and macrophages. Neurons were counterstained with the neuronal marker NeuN in red. Scale bar 200 μm.
- Higher magnification of (A). Scale bar 50 μm.
- Immunofluorescence of the T-cell marker CD3 in the white matter of the lumbar spinal cord. Scale bars 50 μm.