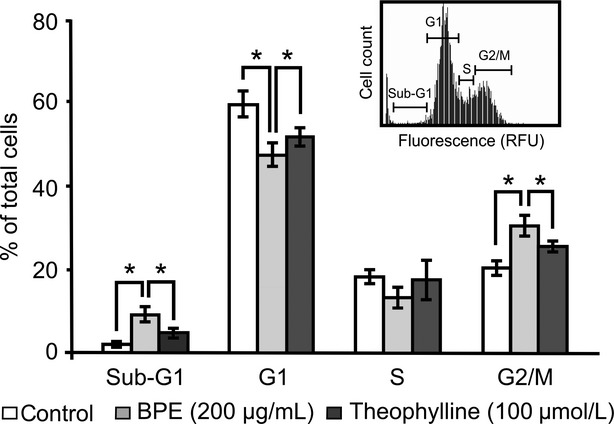
Figure 3.

Effects of BPE on cell cycle and its dependence on Hdac inhibitory activity. Neuro2a cells were treated with 200 μg/mL of BPE in the presence or absence of theophylline for 24 h. Inset shows typical pattern of imaging cytometric analysis of control cells. Percentages of the cell number in each phase were calculated. The values are represented as the mean of the ratio in each phase ± SD (n = 3). *P < 0.05, nonpaired t-test. BPE, Brazilian propolis extract; Hdac, histone deacetylase.
