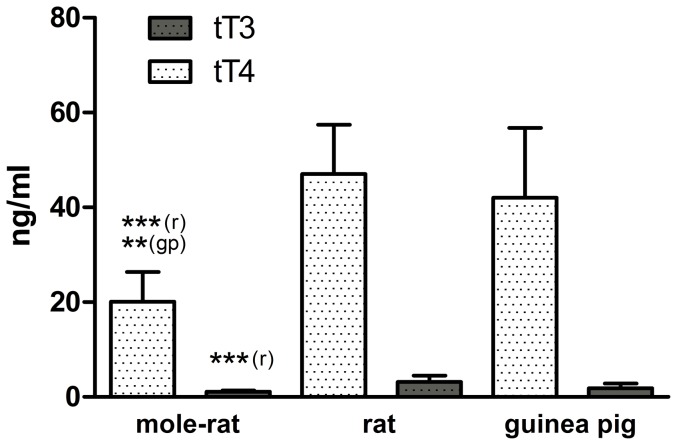
Figure 3. Total T4 and total T3 levels of Ansell's mole-rats (n = 12), rats (n = 7) and guinea pigs (n = 4).
Mean ± SD; all data expressed in ng/ml. One-way ANOVA, tT4: F = 19.51, p<0.0001; fT3: F = 11.13, p = 0.001. Significant differences in the Bonferroni post hoc comparisons are indicated by asterisks coupled with the comparison species referred to (mr = mole-rat, r = rat, gp = guinea pig) in parenthesis. See “Results” section for statistical details and Table 3 for TH ratios obtained from these data.

