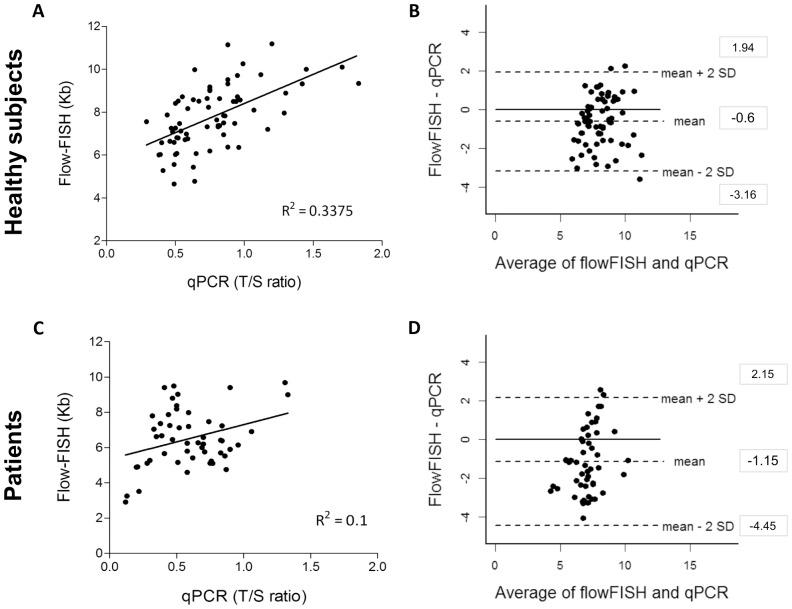
Figure 3. Comparison between qPCR and flow-FISH of leukocyte telomere length in the healthy individuals and patients with bone marrow failure or idiopathic pulmonary fibrosis: linear correlation and Bland-Altman agreement.
Telomere length of 70 healthy individuals was measured by qPCR and flow-FISH: (A) Linear regression plots of qPCR (T/S ratio) x flow-FISH (kb) measurements; solid line represents the data best fit (R2 = 0.33); and (B) Bland-Altman plot for agreement analysis of qPCR (kb) and flow-FISH (kb). The bias±SD was -0.6±1.27 and limits of agreement (LoA) ranged from −3.16 to 1.94. Telomere length of 51 patients was measured by both methods: (C) Linear regression plots of qPCR (T/S ratio) x flow-FISH (kb) measurements and solid line represents the data best fit (R2 = 0.10). (D) Bland-Altman plot for agreement analysis of qPCR (kb) and flow-FISH (kb). The bias±SD was −1.15±1.65 and the LoA ranged from −4.45 to 2.15.

