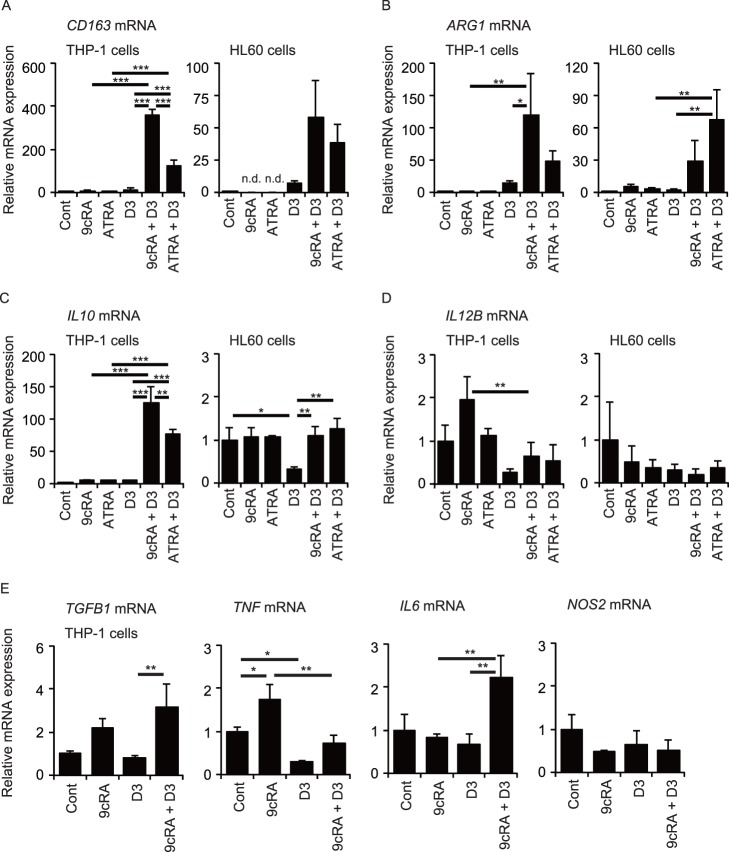
Figure 3. Expression of marker genes of M1 and M2 macrophages.
mRNA levels of the M2 markers CD163 (A), ARG1 (B), IL10 (C), and the M1 marker IL12B (D) in THP-1 and HL60 cells. (E) mRNA levels of the M2 marker TGFB1, the M1 markers TNF, IL6, and NOS2 in THP-1 cells. Cells were treated with vehicle control (Cont), 30 nM 9cRA, or ATRA in the absence or presence of 100 nM 1,25(OH)2D3 (D3) for 72 hours. *, p<0.05; **, p<0.01; ***, p<0.001 (one-way ANOVA followed by Tukey’s multiple comparisons). n.d., not detected.

