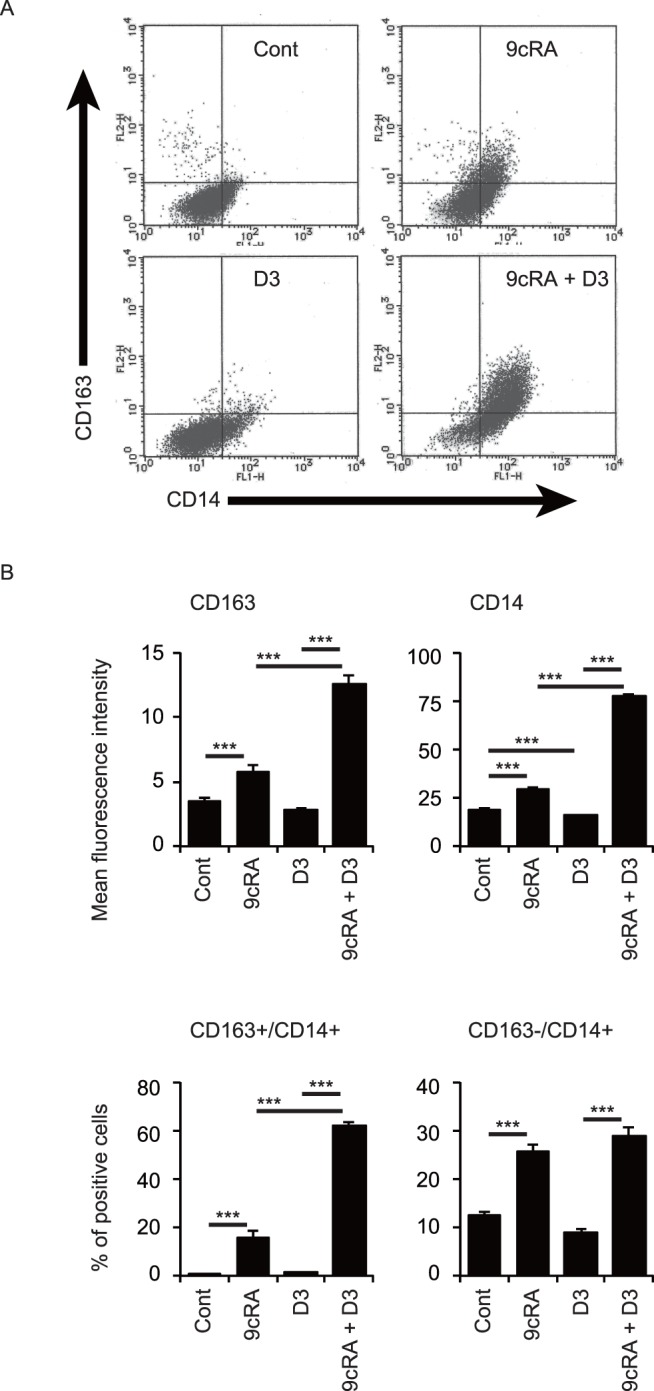
Figure 4. Cell surface expression of CD163 in THP-1 cells.

(A) Representative histograms of CD14 and CD163 expression. (B) Quantification of mean fluorescence intensity of CD163 and CD14 expression. (C) Quantification of percentages of CD163+/CD14+ cells and CD163−/CD14+ cells. Cells were treated with vehicle control (Cont), 100 nM 9cRA and/or 100 nM 1,25(OH)2D3 (D3) for 96 hours. **, p<0.01; ***, p<0.001 (one-way ANOVA followed by Tukey’s multiple comparisons).
