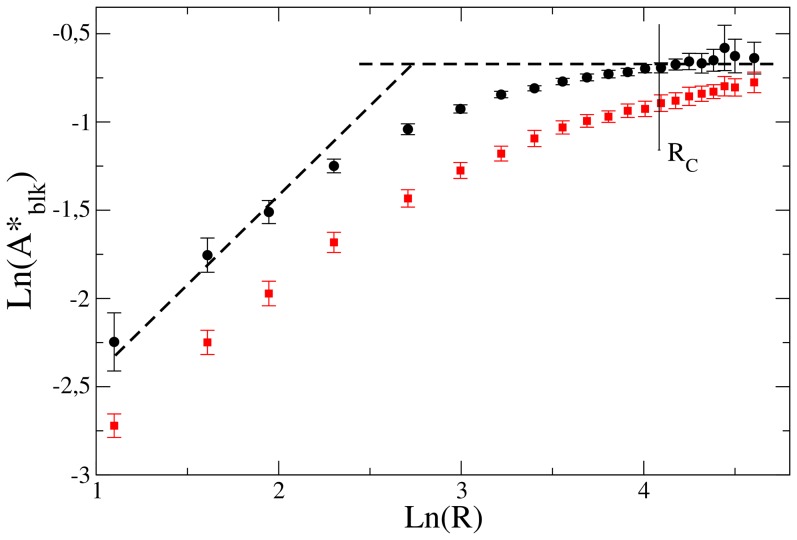
Figure 6. In black circles, the logarithm of inflexion points, from curves showed in Fig. 4, versus the logarithm of  .
.
We compare to two straight dashed lines with slope 1 and 0. We observe that the transition points follow  for
for  much smaller than
  and
and  for
for  . In red squares the same for
  lattice units.

