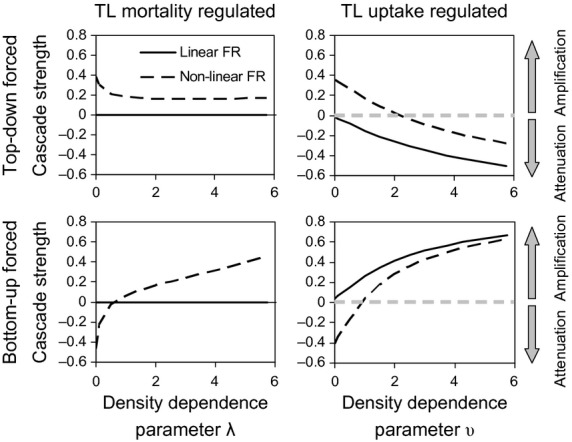
Figure 4.

Steady-state effects of density-dependent regulation on the strength of top-down and bottom-up trophic cascades, derived from analytical solutions to the 3-level food chain equations. Positive values of the strength index indicate amplification of the top-down or bottom-up effect; negative values indicate attenuation. Solid lines show the strength of the response with a linear functional relationship (FR) between uptake and prey abundance, dashed with a nonlinear (Type-II) relationship. The x-axis in each case refers to values of the parameter determining the intensity of either mortality or uptake regulation. Top-down cascade strength is as specified by eqn 29, bottom-up strength by eqn 30.
