Figure 3.

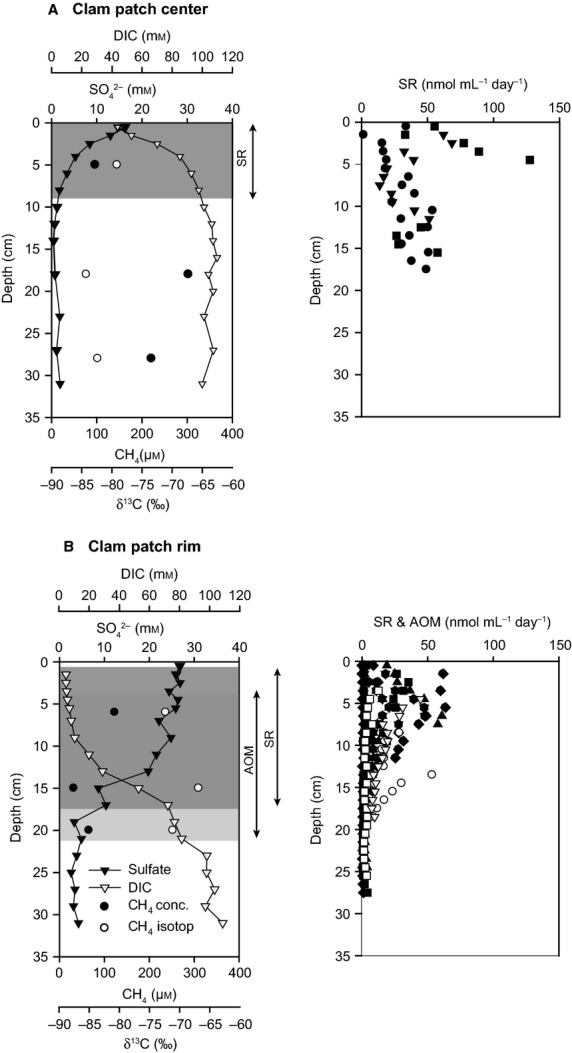
Left panel: Sulfate (black triangles) and DIC (white triangles) concentrations were measured in the pore water from the center (A) and the rim (B) of the JTC colony. Potential SR and AOM horizons according to pore water concentrations are highlighted. Furthermore, methane concentration (black dots) and isotopic composition (white dots) were determined at both locations. Right panel: SR rates (in black) and AOM rates (in white) from the center and the rim of the JTC colony. The different symbols represent replicates of turnover rate measurements.
