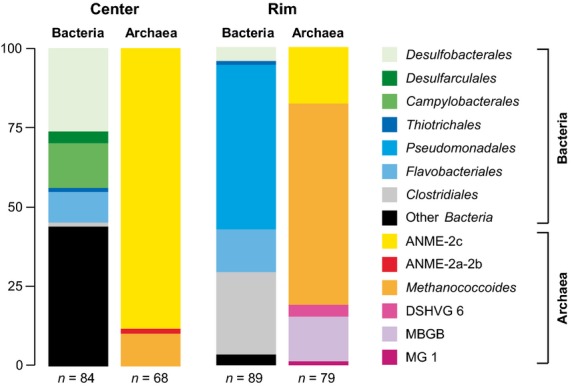
Figure 6.

Relative 16S rRNA clone frequencies. Archaeal and bacterial diversity in the center and at the rim of the JTC colony. The scale bar represents relative clone frequencies in percent. The total number of clones per gene library is indicated below the respective column. DSHVG, Deep Sea Hydrothermal Vent Group, MBGB, Marine Benthic Group B, MG1, Marine Group 1.
