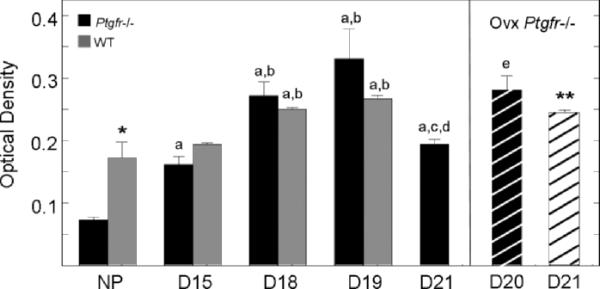
FIG. 4.
Mean OD ± SEM normalized to cell density of picrosirius red-stained sections of cervix from nonpregnant or pregnant Ptgfr−/− and wild-type mice (n = 3–5 per group; three sections were analyzed per mouse). Analysis of a reversed grayscale image by National Institutes of Health ImageJ software indicated higher mean OD on D18 and PP compared with NP and D15 groups. Higher OD values denote regions of reduced birefringence, indicative of reduced collagen and diffuse structure. Symbols denote P < 0.05 when a specific group in the same strain was compared to NP mice (a), or groups D15 (b), D18 (c), D19 (d), or D21 (e) of pregnancy (for Ptgfr−/− mice, ANOVA F = 21.59, df = 4; for wild-type mice, chi-square=13.15, df = 3). *P < 0.05 to NP Ptgfr−/− when compared controls; **P < 0.05 when compared to D19 WT controls.

