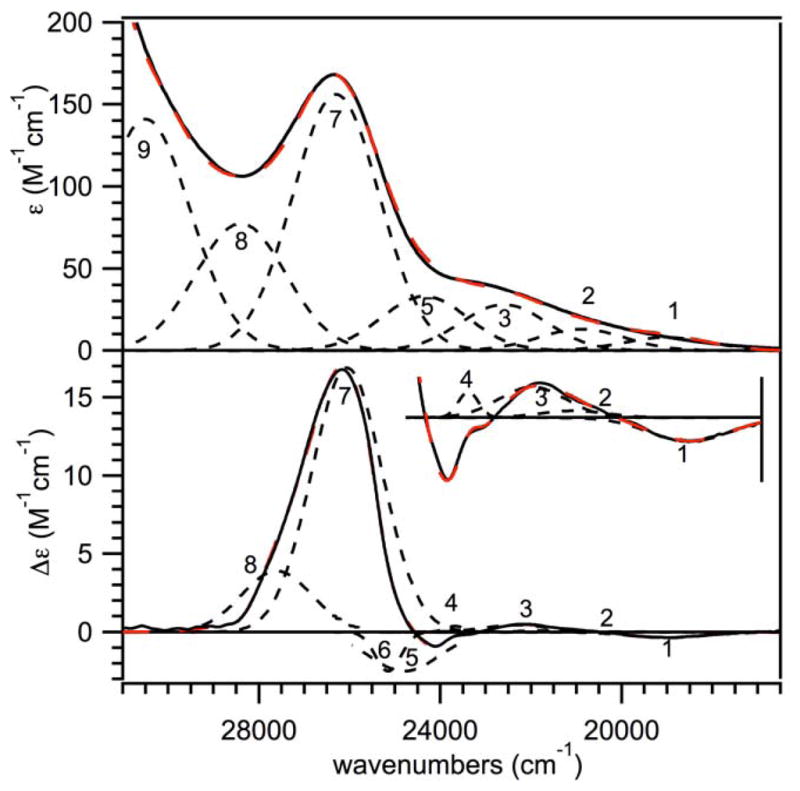
Figure 5.

298 K electronic absorption (top) and 2 K, 7 T MCD (bottom) spectra of [MnIII(O2)(TpPh2)(THF)]. Inset: An 15-fold enhancement of the 2 K, 7 T MCD spectra from 17 500 to 25 000 cm−1. Individual Gaussian curves (black dotted lines) and their sums (red dashed lines) obtained from iterative fits of these data sets are displayed on their respective spectra. Only Gaussian bands 1 – 4 are shown in the inset. Conditions: Absorption data were collected for a 2.5 mM sample in THF. MCD data were collected for a 15 mM frozen glass sample in 75:25 solution of 2-Me-THF:THF.
