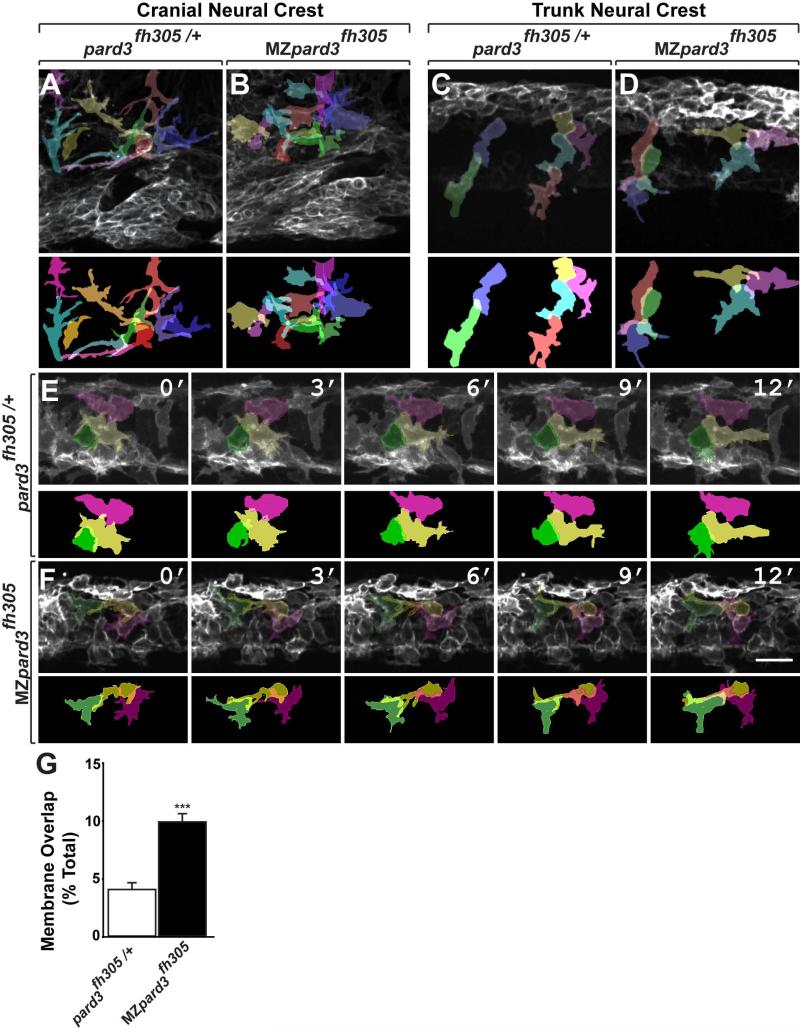
Fig. 4.
Pard3 mediates contact inhibition between neural crest cells. A-F: Individual neural crest cell tracings represented as colored objects. A,B: Representative images of cranial neural crest cell migration in control (A) and mutant (B) embryos. In some regions, neural crest cells appear more tightly packed in mutant than in control. C,D: Representative images of trunk neural crest cells in control (C) and mutant (D) embryos; lateral view. Neural crest cells form chains elongated in the direction of migration in the control embryo (C). By contrast, neural crest cells appear less elongated and to be less well organized as chains in the mutant (D). E,F: Representative frames captured from time-lapse movies of trunk neural crest cell delamination in control (E) and mutant (F) embryos. Views are from dorsal with anterior to the left. Numbers denote time elapsed, in minutes, from start of imaging. Embryos are siblings and imaged sequentially in the same chamber. Neural crest cells in control embryos (n=30) retract cell membrane upon contact with neighboring cells. By contrast, neural crest cells in mutant embryos (n=24) fail to retract cell membrane and maintain cell overlap (F). G: Quantification of trunk neural crest cell membrane overlap during delamination (pard3fh305/+, n= 3 embryos, 43 cells; MZpard3fh305, n= 4 embryos, 47 cells; *** p = 0.0001; Student's t-test). Scale bar, 25uM.

