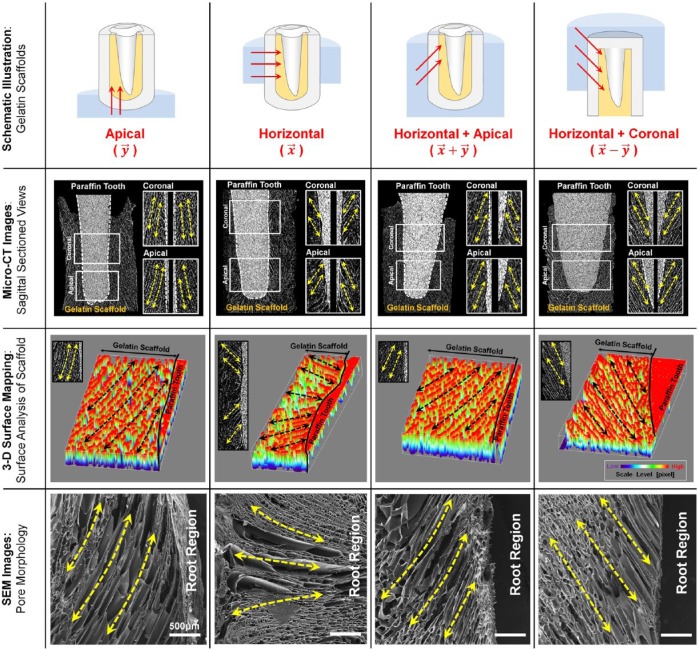
Figure 3.
Digitized cross-sectional views of 3-dimensional reconstructed images for qualitative analyses of directionally generated pore structures. Longitudinal cross-section images with 11-µm thickness showed the pore morphologies at the coronal and apical portions (second row). Grayscale intensity-based 3-dimensional surface mappings demonstrated pore angulations to the surface of the paraffin tooth and qualitative comparisons among groups (third row). The scanning electron microscopic images provided longitudinal pores that the freeze-casting method produced (fourth row). Yellow dashed/arrowed lines represent the pore directionalities, and black dashed/arrowed lines show the directional pore architecture. Scale bar: 500 µm.

