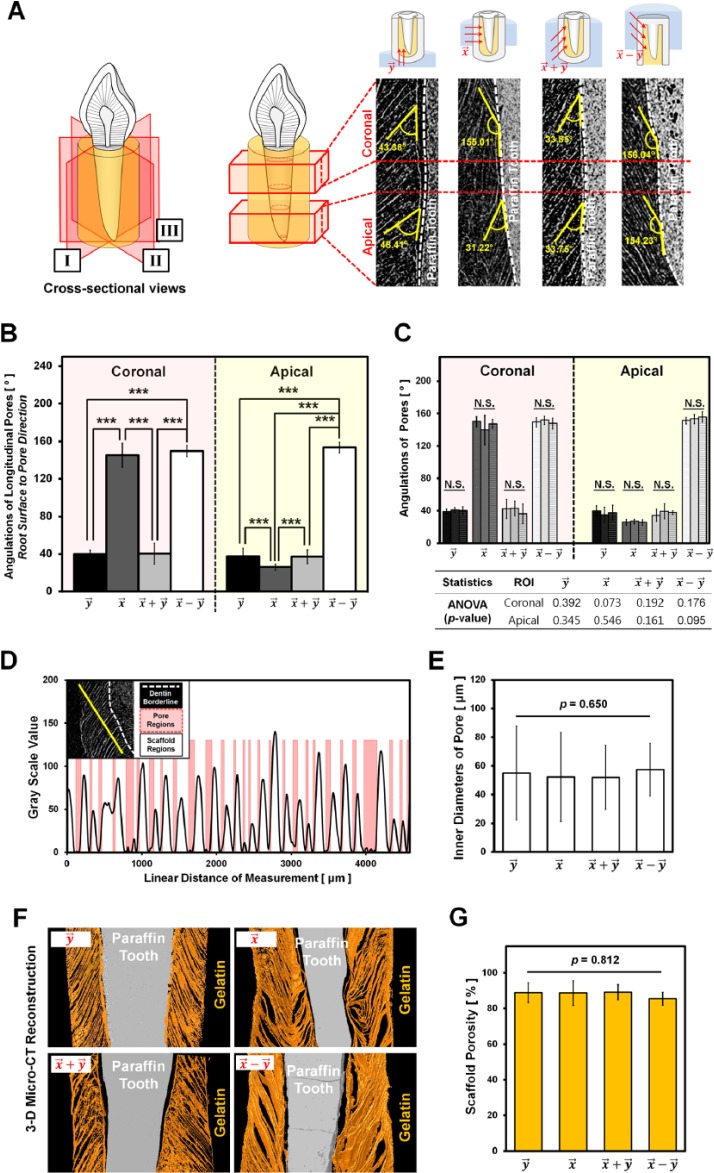
Figure 4.
Quantitative analysis of pore angulations, pore sizes, and porosities using micro–computed tomography images. (A) The schematic illustration (left) represents 3 cross sections per gelatin scaffold (I, II, and III) for spatial analyses, and each section was analyzed with the coronal and apical portions (right). The pore angles were measured via the baseline for angulation (i.e., the paraffin tooth root surface; right). (B) Quantitative analysis of pore angulations among groups showed that and had significant differences compared to the freezing groups, and (***p < .001). However, (C) the angulations of the samples in each group showed similarities according to analysis of variance p values, as shown in the table (p > .05; N.S., not significant). (D) The plot profile shows the gelatin structures and pore regions based on the grayscale values. The red-highlighted regions represent the pores, and their diameters were measured via the plot profiles. (E) There was no significant difference among the groups (, , , and ; p = .650). (F) Three-dimensional reconstructed colorized images of the groups. The gray areas represent paraffin teeth, and the orange-colored regions are the gelatin scaffolds. (G) The porosities were calculated and statistically analyzed with 3-dimensional reconstructed images. There was no significant difference in porosity (p = .812).

