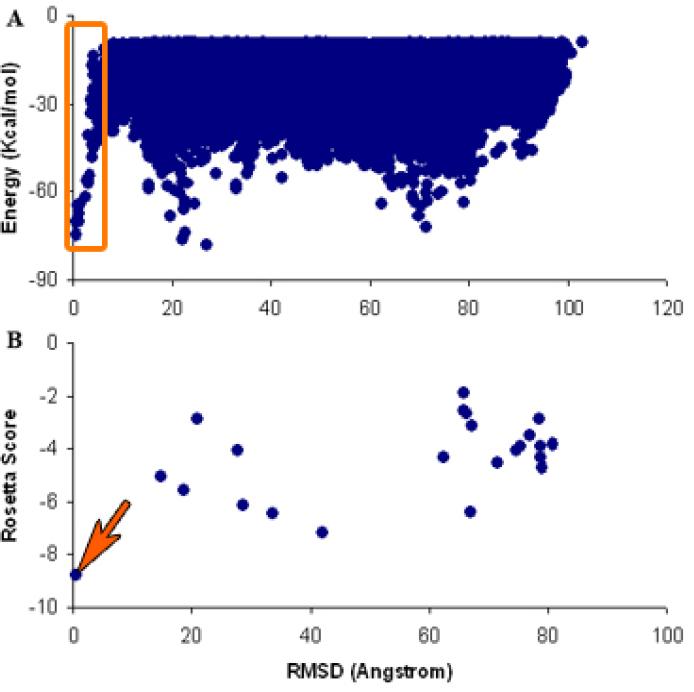
Fig. 4.
Interaction energy (score) vs. RMSD between the predicted and crystal structures. (A) Structures from BD simulations followed by rigid body energy minimization. The sampled complexes near to crystal dimer are marked with an orange rectangular box. (B) 23 reprehensive structures of the cluster from the top 200 lowest energy predicted structures. The lowest energy predicted complex is marked with an orange arrow (RMSD = 0.49 Å from the crystal structure).

