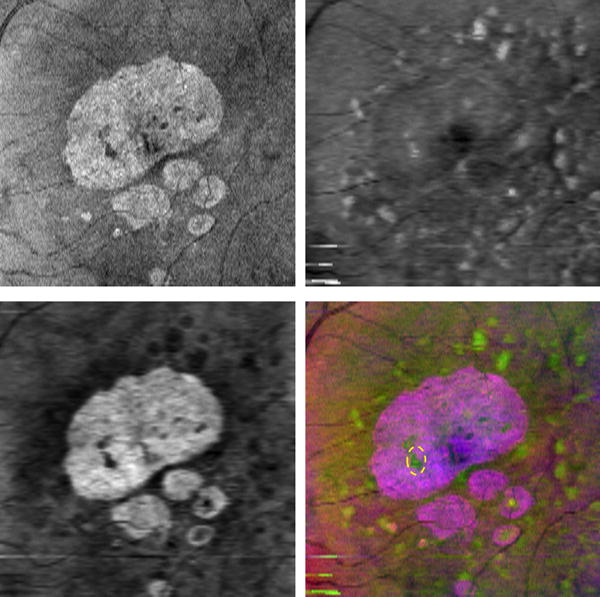
Figure 6.

False color fusion for drusen and GA visualization. Top Left: SVP projection image (R component). Top Right: Drusen projection image (G component). Bottom Left: GA projection image (B component). Bottom Right: False color image, where the dashed yellow oval represents a drusen within the big GA region.
